Case study, page T-0056
Found every statementMinor T wave abnormalities
PTB-XL record 8036, a man aged 54. A public research ECG from Germany, printed on A4, photographed by TraceRead's photo simulator and read end to end. Below is the AI first read, next to the original recording and what the dataset's cardiologists recorded.
0.88
median match with the original recording
0.99 after lining up by up to a tenth of a second
2 of 2
cardiologists' statements that TraceRead AI also flagged
6
extra patterns flagged for the doctor to keep or remove
83
heart rate from the photo, beats a minute
83 on the original recording
The AI first read
What the reading doctor gets
Hover a lead to see how closely the red rebuilt line follows the original recording. Untick the box to see the page without it.
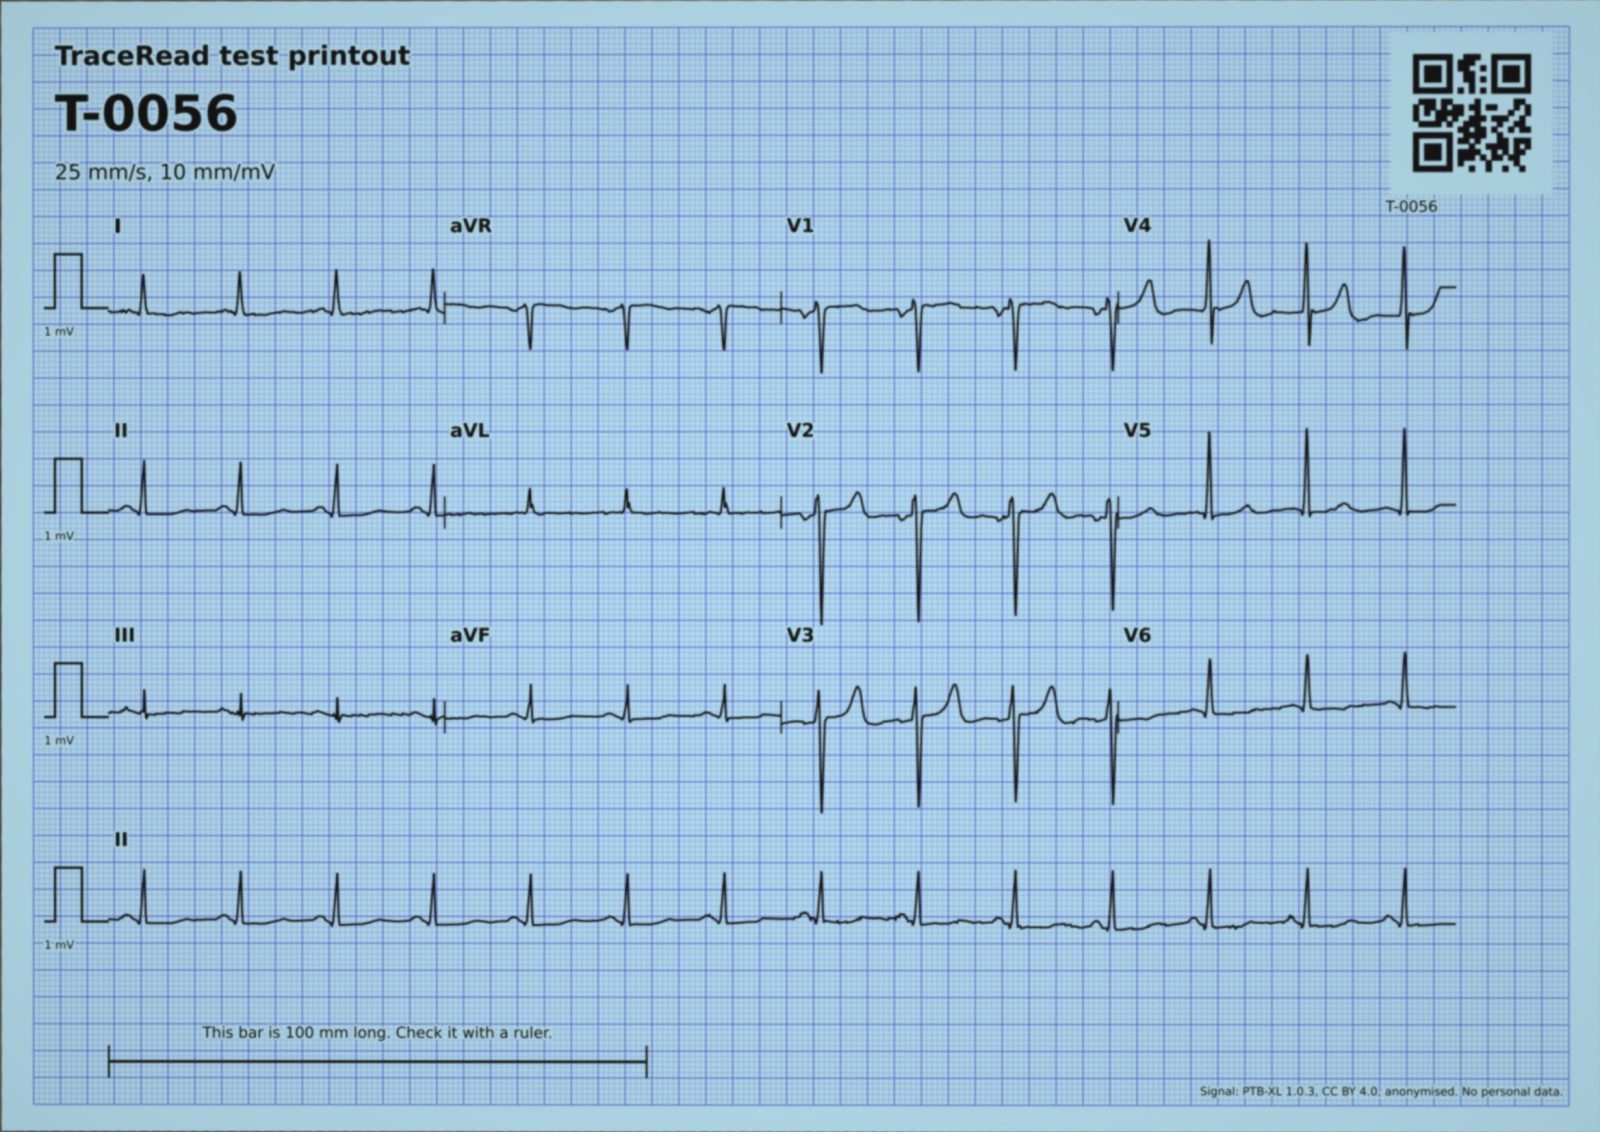
Numbers under each lead: how closely the rebuilt line follows the original recording, where 1.00 is a perfect match. Median for this page: 0.88.
PTB-XL record 8036, a man aged 54. A4 paper, 3x4 with one lead II strip, pulses read 4 of 4.
Measures
| Measure | From the photo | Original recording | Reference program |
|---|---|---|---|
| Heart rate (beats a minute) | 83 | 83 | |
| PR interval (ms) | 165 | 162 | |
| QRS width (ms) | 75 | 74 | |
| QT interval (ms) | 384 | 376 | |
| QTc, corrected for heart rate (ms) | 428 | 420 | |
| Heart axis (degrees) | 27 | 26 |
Patterns flagged, with TraceRead AI's score
Sinus rhythm
the usual rhythm, started by the heart's natural pacemaker
96Minor T wave abnormalities
small changes in the last part of the beat that are not enough to point to a cause
54Low T waves
the last part of each beat is smaller than usual
21ST depression
the middle part of the beat sits lower than usual
19Unspecific ST changes
small changes in the middle part of the beat that do not point to one cause
15Unspecific T wave changes
changes in the last part of the beat that do not point to one cause
15Left ventricular hypertrophy
the muscle wall of the main pumping chamber may be thicker than usual
5Unspecific reduced blood flow pattern
beat changes that can go with reduced blood flow to the heart muscle, without a clear place
3
What the dataset's cardiologists recorded for this ECG
- Minor T wave abnormalities
- Sinus rhythm
Against the cardiologists
TraceRead AI and the dataset's cardiologists, side by side
TraceRead AI flagged 8 patterns. 2 of them are also among the dataset's statements (Sinus rhythm and Minor T wave abnormalities). Not in the dataset's statements: Low T waves, ST depression, Unspecific ST changes, Unspecific T wave changes and 2 more.
Found by both 2
Minor T wave abnormalities
Small changes in the last part of the beat that are not enough to point to a cause.
54Sinus rhythm
The usual rhythm, started by the heart's natural pacemaker.
96
Recorded by the cardiologists only 0
Nothing: TraceRead AI flagged every statement they recorded.
Flagged by TraceRead AI only 6
Low T waves
The last part of each beat is smaller than usual.
21ST depression
The middle part of the beat sits lower than usual.
19Unspecific ST changes
Small changes in the middle part of the beat that do not point to one cause.
15Unspecific T wave changes
Changes in the last part of the beat that do not point to one cause.
15Left ventricular hypertrophy
The muscle wall of the main pumping chamber may be thicker than usual.
5Unspecific reduced blood flow pattern
Beat changes that can go with reduced blood flow to the heart muscle, without a clear place.
3
The doctor's review
What the reading doctor would check here
Worked out from this run's own numbers: where the rebuilt line strays, which measures moved, and which flags to keep or remove.
- 1The rebuilt line strays from the original recording in V2 (0.85), III (0.70) and aVF (0.76). Compare those leads with the paper first.
- 2Every measure from the photo is close to the same measure on the original recording.
- 3TraceRead AI flagged 6 patterns the cardiologists did not record: low T waves, ST depression, unspecific ST changes, unspecific T wave changes, left ventricular hypertrophy and unspecific reduced blood flow pattern. The doctor keeps or removes each one.
- 4The calibration pulse looks wider than expected, which would mean a paper speed of about 30.2 millimetres a second. TraceRead still reads the page at 25 millimetres a second, the usual speed, so timings could be a little off if that reading were right.
An AI first read is not the last word.
- A qualified doctor reviews every AI first read. Nothing reaches a patient until a doctor signs it.
- Do not rely on TraceRead alone in an emergency.
- A normal AI first read does not rule out heart disease.
- For adults, 18 and over.
Stage by stage
How TraceRead read this page
Every step of this run, with what went in and what came out.
Step 1: the photo
On the phoneWhat went in: one photo of a printed ECG
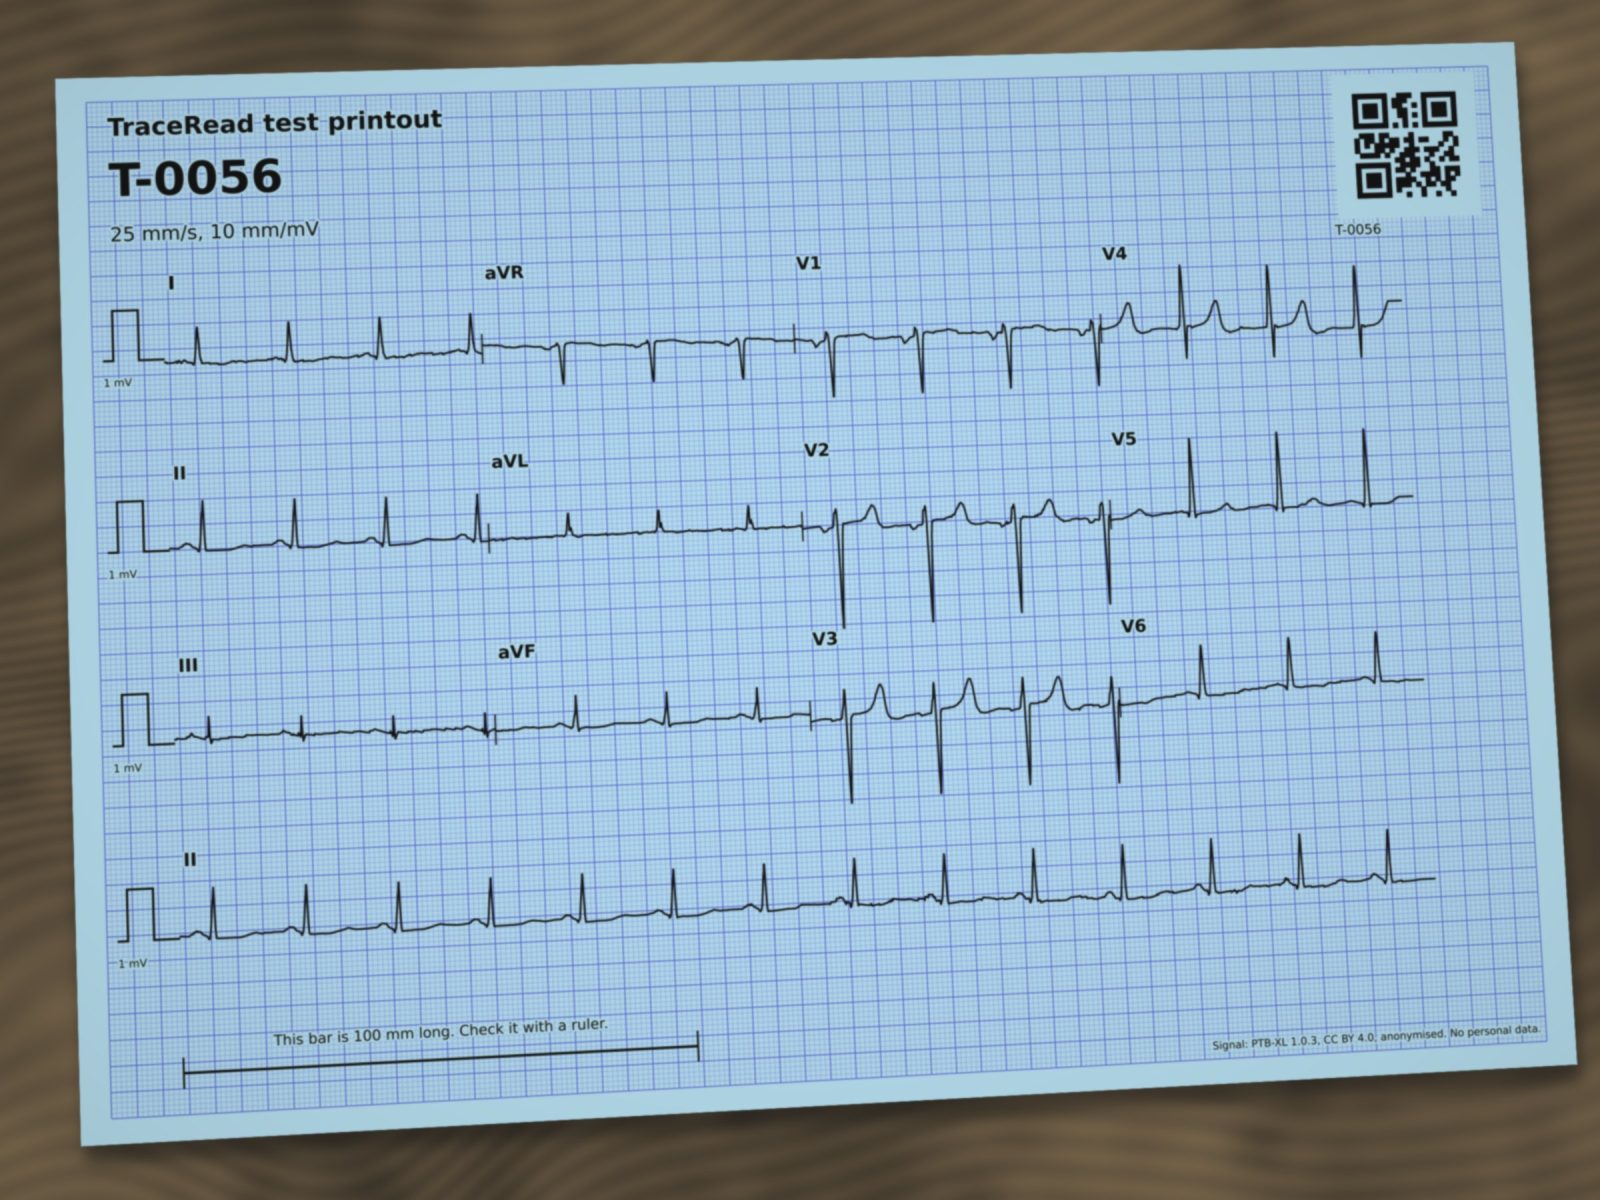
PTB-XL record 8036, a public research ECG from Germany, was printed as page T-0056 on A4 at 25 mm a second and 10 mm per millivolt. TraceRead's photo simulator then took a photo of it: tilted, lit unevenly, slightly blurred, with sensor noise and JPEG compression, the way a phone camera would.
This record was in PTB-XL's test set, so TraceRead AI never saw it during training. The person was a man aged 54. Age and sex are all TraceRead keeps.
Step 2: page finder
TraceRead AIFind the paper and how it is turned
TraceRead AI looks at the whole photo and marks the four corners of the page, and which way up it is. Fixed code then measures the printed millimetre grid to correct the scale and the tilt, and makes the page flat.
- Page found
- yes
- Turned
- 0 degrees
- Paper
- A4
Step 3: layout reader
TraceRead AIWork out where each lead sits
Every row of a printout starts with a calibration pulse, a small square step that is 10 mm tall for 1 millivolt. TraceRead AI finds the pulses, and fixed code matches them against 14 known page layouts to work out where each of the 12 leads sits and how long it runs.
- Layout
- 3x4 with one lead II strip
- Calibration pulses read
- 4 of 4
- Height of 1 millivolt
- 10 mm
- Paper speed used
- 25 mm a second
- Pulse width suggested
- 30.2 mm a second
- Layout match
- 0.988
Warnings this step raised
- The calibration pulse looks wider than expected, which would mean a paper speed of about 30.2 millimetres a second. TraceRead still reads the page at 25 millimetres a second, the usual speed, so timings could be a little off if that reading were right.
Step 4: trace rebuild
TraceRead AIRebuild every lead as a digital signal
TraceRead AI marks which pixels are trace ink. Fixed code then follows the ink of each lead, column by column, and turns it into millivolts, 500 points a second. The rebuilt line is drawn back over the paper so a doctor can see at a glance if a lead was misread.
Because this ECG is public, we can check the rebuilt signal against the original recording. 1.00 would be a perfect match; the second number allows the two to be lined up by up to a tenth of a second.
| Lead | Seconds shown | Ink found | Match | Lined up |
|---|---|---|---|---|
| I | 0 to 2.5 | 100% | 0.95 | 0.99 |
| aVR | 2.5 to 5 | 100% | 0.88 | 0.99 |
| V1 | 5 to 7.5 | 100% | 0.88 | 0.99 |
| V4 | 7.5 to 10 | 100% | 0.92 | 0.94 |
| II | 0 to 2.5 | 100% | 0.95 | 0.98 |
| aVL | 2.5 to 5 | 100% | 0.86 | 0.97 |
| V2 | 5 to 7.5 | 100% | 0.85 | 0.99 |
| V5 | 7.5 to 10 | 100% | 0.96 | 0.99 |
| III | 0 to 2.5 | 100% | 0.70 | 0.71 |
| aVF | 2.5 to 5 | 100% | 0.76 | 0.97 |
| V3 | 5 to 7.5 | 100% | 0.85 | 0.99 |
| V6 | 7.5 to 10 | 100% | 0.97 | 1.00 |
| II, rhythm strip | 0 to 10 | 0.91 | 0.98 |
Median match for this page: 0.88.
Step 5: coverage map
Fixed codeMark which seconds the paper shows
A 3x4 printout shows each lead for only 2.5 of the 10 seconds the machine recorded. The coverage map tells the pattern finder exactly which seconds of each lead it has, so a part that is not on the paper is never read as a flat line.
Step 6: hold for retake
Fixed codeDecide whether the photo can be read
Before any pattern is read, a fixed hold rule decides whether the rebuild can be trusted. Version 1 looked only at how well the page matched a known layout and how unsure the AI was about the five main groups. Version 2 also checks the calibration, the page shape, how much trace was found, whether the overlapping lead II pieces agree, and clipped or flat parts. If the rebuilt trace looks unreliable, it asks for a new photo instead of giving a first read. Both versions' decisions for this page are shown below.
The layout match score was 0.988 (a photo is held back when the score is below 0.888) and 4 of 4 calibration pulses were read. The AI's own uncertainty about the five main heart groups was 0.211 (a photo is held back above 0.497). Neither check fired, so the photo is used.
- Every check passed, so the rebuilt trace is used.
| Check | Value | Limit | Result |
|---|---|---|---|
| page_found | passed | ||
| gain_standard | 0.009 | 0.05 | passed |
| paper_speed | 30.16 | 2434 | passed |
| layout_match | 0.988 | 0.889 | passed |
| page_shape | 1.004 | 1.7 | passed |
| ink_median | 1 | 0.9 | passed |
| coverage | 1 | 1 | passed |
| lead_ii_agree | 0.989 | 0.49 | passed |
| lead_ii_amplitude | 0.008 | 0.5 | passed |
| goldberger | 0.107 | 1.45 | passed |
| edge_clipping | 0 | 0.027 | passed |
| flat_run | 0.011 | 0.34 | passed |
| lead_ii_raw | 0.989 | 0.2 | passed |
Step 7: measures
Fixed codeMeasure the heartbeat
Fixed code finds every beat, lines the leads up and measures them together. The same code run on the original recording shows how much the photo changed each number, and a reference ECG program from the PTB-XL+ dataset gives a second opinion.
| Measure | From the photo | Original recording | Reference program |
|---|---|---|---|
| Heart rate (beats a minute) | 83 | 83 | 83 |
| PR interval (ms) | 165 | 162 | 122 |
| QRS width (ms) | 75 | 74 | 84 |
| QT interval (ms) | 384 | 376 | 402 |
| QTc, corrected for heart rate (ms) | 428 | 420 | 448 |
| Heart axis (degrees) | 27 | 26 | 46 |
Step 8: pattern finder
TraceRead AIScore 71 patterns and flag the ones that pass their line
TraceRead AI reads the 12 rebuilt leads and the coverage map together and scores 71 patterns of rhythm, conduction, thickened heart muscle and ST and T changes. A pattern is flagged when its score passes a line set in advance on other ECGs, never on this one. The lines are set so that patterns are not missed, which is why a pattern can be flagged with a low score, and why some flags are wrong: the doctor decides.
What the dataset's cardiologists recorded for this ECG
- Minor T wave abnormalities
- Sinus rhythm
TraceRead AI flagged 8 patterns. 2 of them are also among the dataset's statements (Sinus rhythm and Minor T wave abnormalities). Not in the dataset's statements: Low T waves, ST depression, Unspecific ST changes, Unspecific T wave changes and 2 more.
TraceRead AI's score for each pattern, from 0 to 100. The thin line is where that pattern gets flagged.
Sinus rhythm
flaggedthe usual rhythm, started by the heart's natural pacemaker
96Minor T wave abnormalities
flaggedsmall changes in the last part of the beat that are not enough to point to a cause
54Low T waves
flaggedthe last part of each beat is smaller than usual
21ST depression
flaggedthe middle part of the beat sits lower than usual
19Unspecific ST changes
flaggedsmall changes in the middle part of the beat that do not point to one cause
15Unspecific T wave changes
flaggedchanges in the last part of the beat that do not point to one cause
15Left ventricular hypertrophy
flaggedthe muscle wall of the main pumping chamber may be thicker than usual
5Unspecific reduced blood flow pattern
flaggedbeat changes that can go with reduced blood flow to the heart muscle, without a clear place
3
See TraceRead read a paper ECG
We show you TraceRead reading public research ECGs, step by step, and talk through how your team prints, photographs and reads ECGs today.